KentuckyLexington-Fayette County
See how Lexington-Fayette County performed on our equity assessment of its ARPA Local Fiscal Recovery Fund investment strategy.
Total Equity Focused ARPA Funds
$82,072,524$82,072,524
Overall Score
High
Featured Case Study
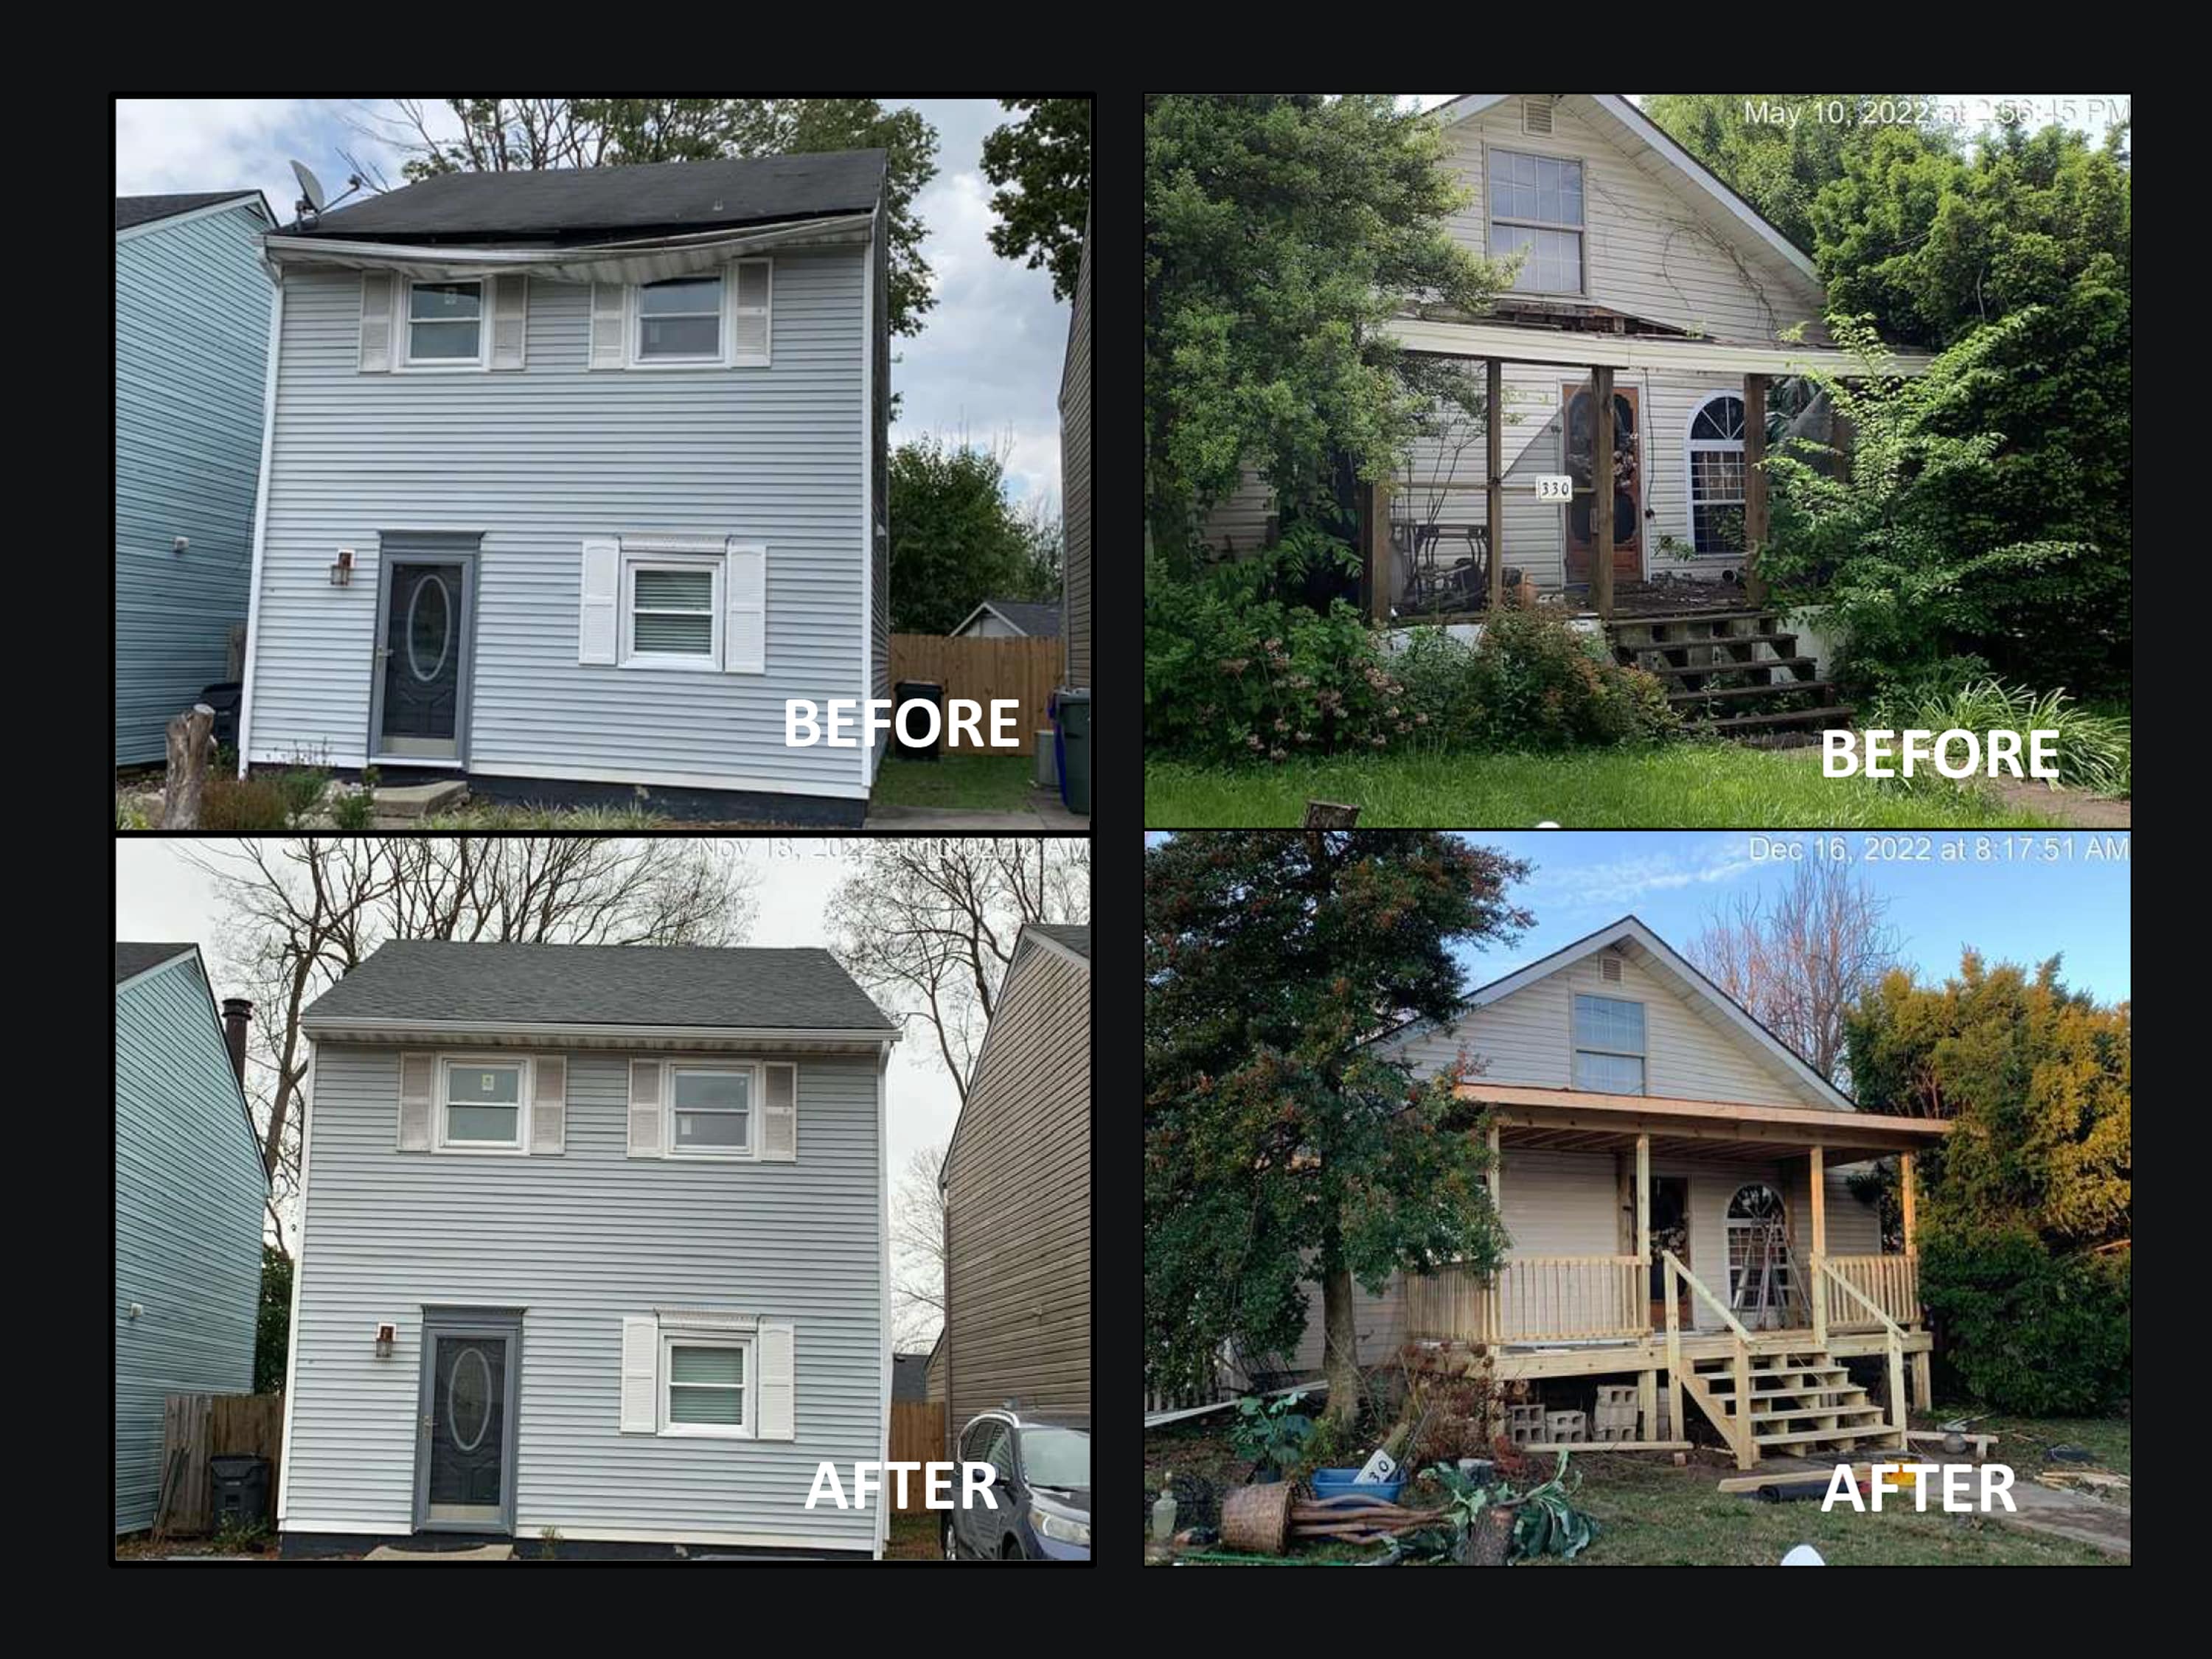
Lexington-Fayette County, Kentucky dedicated $400,000 in ARPA funds and $162,000 in General Funds to launch the Housing Repair Assistance Program, aiming to safeguard low-income homeowners from displacement and predatory developers by helping them address housing code violations.
ARPA Equity Assessment of Lexington-Fayette County, KY
Overall Equity Focus
 High
HighWas racial and economic equity an explicit focus of the jurisdiction's ARPA investment strategy?
 95% of locations met this criterion.81% of locations met this criterion.86% of locations met this criterion.
Equity Decision Making Tools and Resources
HighAre equity tools, frameworks, and structures in place to support equitable investment project identification, design, and implementation?
38% of locations met this criterion.The County prioritized projects that have a direct impact on vulnerable populations and those most impacted by the pandemic when allocating ARPA funds.
24% of locations met this criterion.In July 2021, an ordinance was adopted to establish a permanent Racial Justice and Equality Commission.
 31% of locations met this criterion.51% of locations met this criterion.
Lexington has a Racial Justice and Equality Commission, which has 15 members on staff.
31% of locations met this criterion.48% of locations met this criterion.72% of locations met this criterion.38% of locations met this criterion.Community Engagement
 Middle
Did the jurisdiction engage community members in decision making about the ARPA funds, conduct targeted outreach to historically excluded communities, and implement strategies to reach underserved communities?
94% of locations met this criterion.64% of locations met this criterion.54% of locations met this criterion.Equitable Labor Practices
This section of the assessment was omitted for jurisdictions that reported $0 in spending infrastructure projects (to which these labor practices would apply).
Equity Investments
HighDid the jurisdiction make investments that have the potential to advance equity by targeting the communities most harmed by the pandemic and addressing systemic inequities?
62% of locations met this criterion.71% of locations met this criterion.64% of locations met this criterion.82% of locations met this criterion.63% of locations met this criterion.81% of locations met this criterion.45% of locations met this criterion.33% of locations met this criterion.32% of locations met this criterion.64% of locations met this criterion.64% of locations met this criterion.31% of locations met this criterion.67% of locations met this criterion.56% of locations met this criterion.50% of locations met this criterion.Transparency & Accountability
HighDoes the jurisdiction set performance goals, collect data to monitor progress toward equitable outcomes, and provide the public with information about how funds are being used?
55% of locations met this criterion.70% of locations met this criterion.64% of locations met this criterion.75% of locations met this criterion.