ColoradoDenver
See how Denver performed on our equity assessment of its ARPA Local Fiscal Recovery Fund investment strategy.
Total Equity Focused ARPA Funds
$218,275,236$218,275,236
Overall Score
High
Featured Case Study
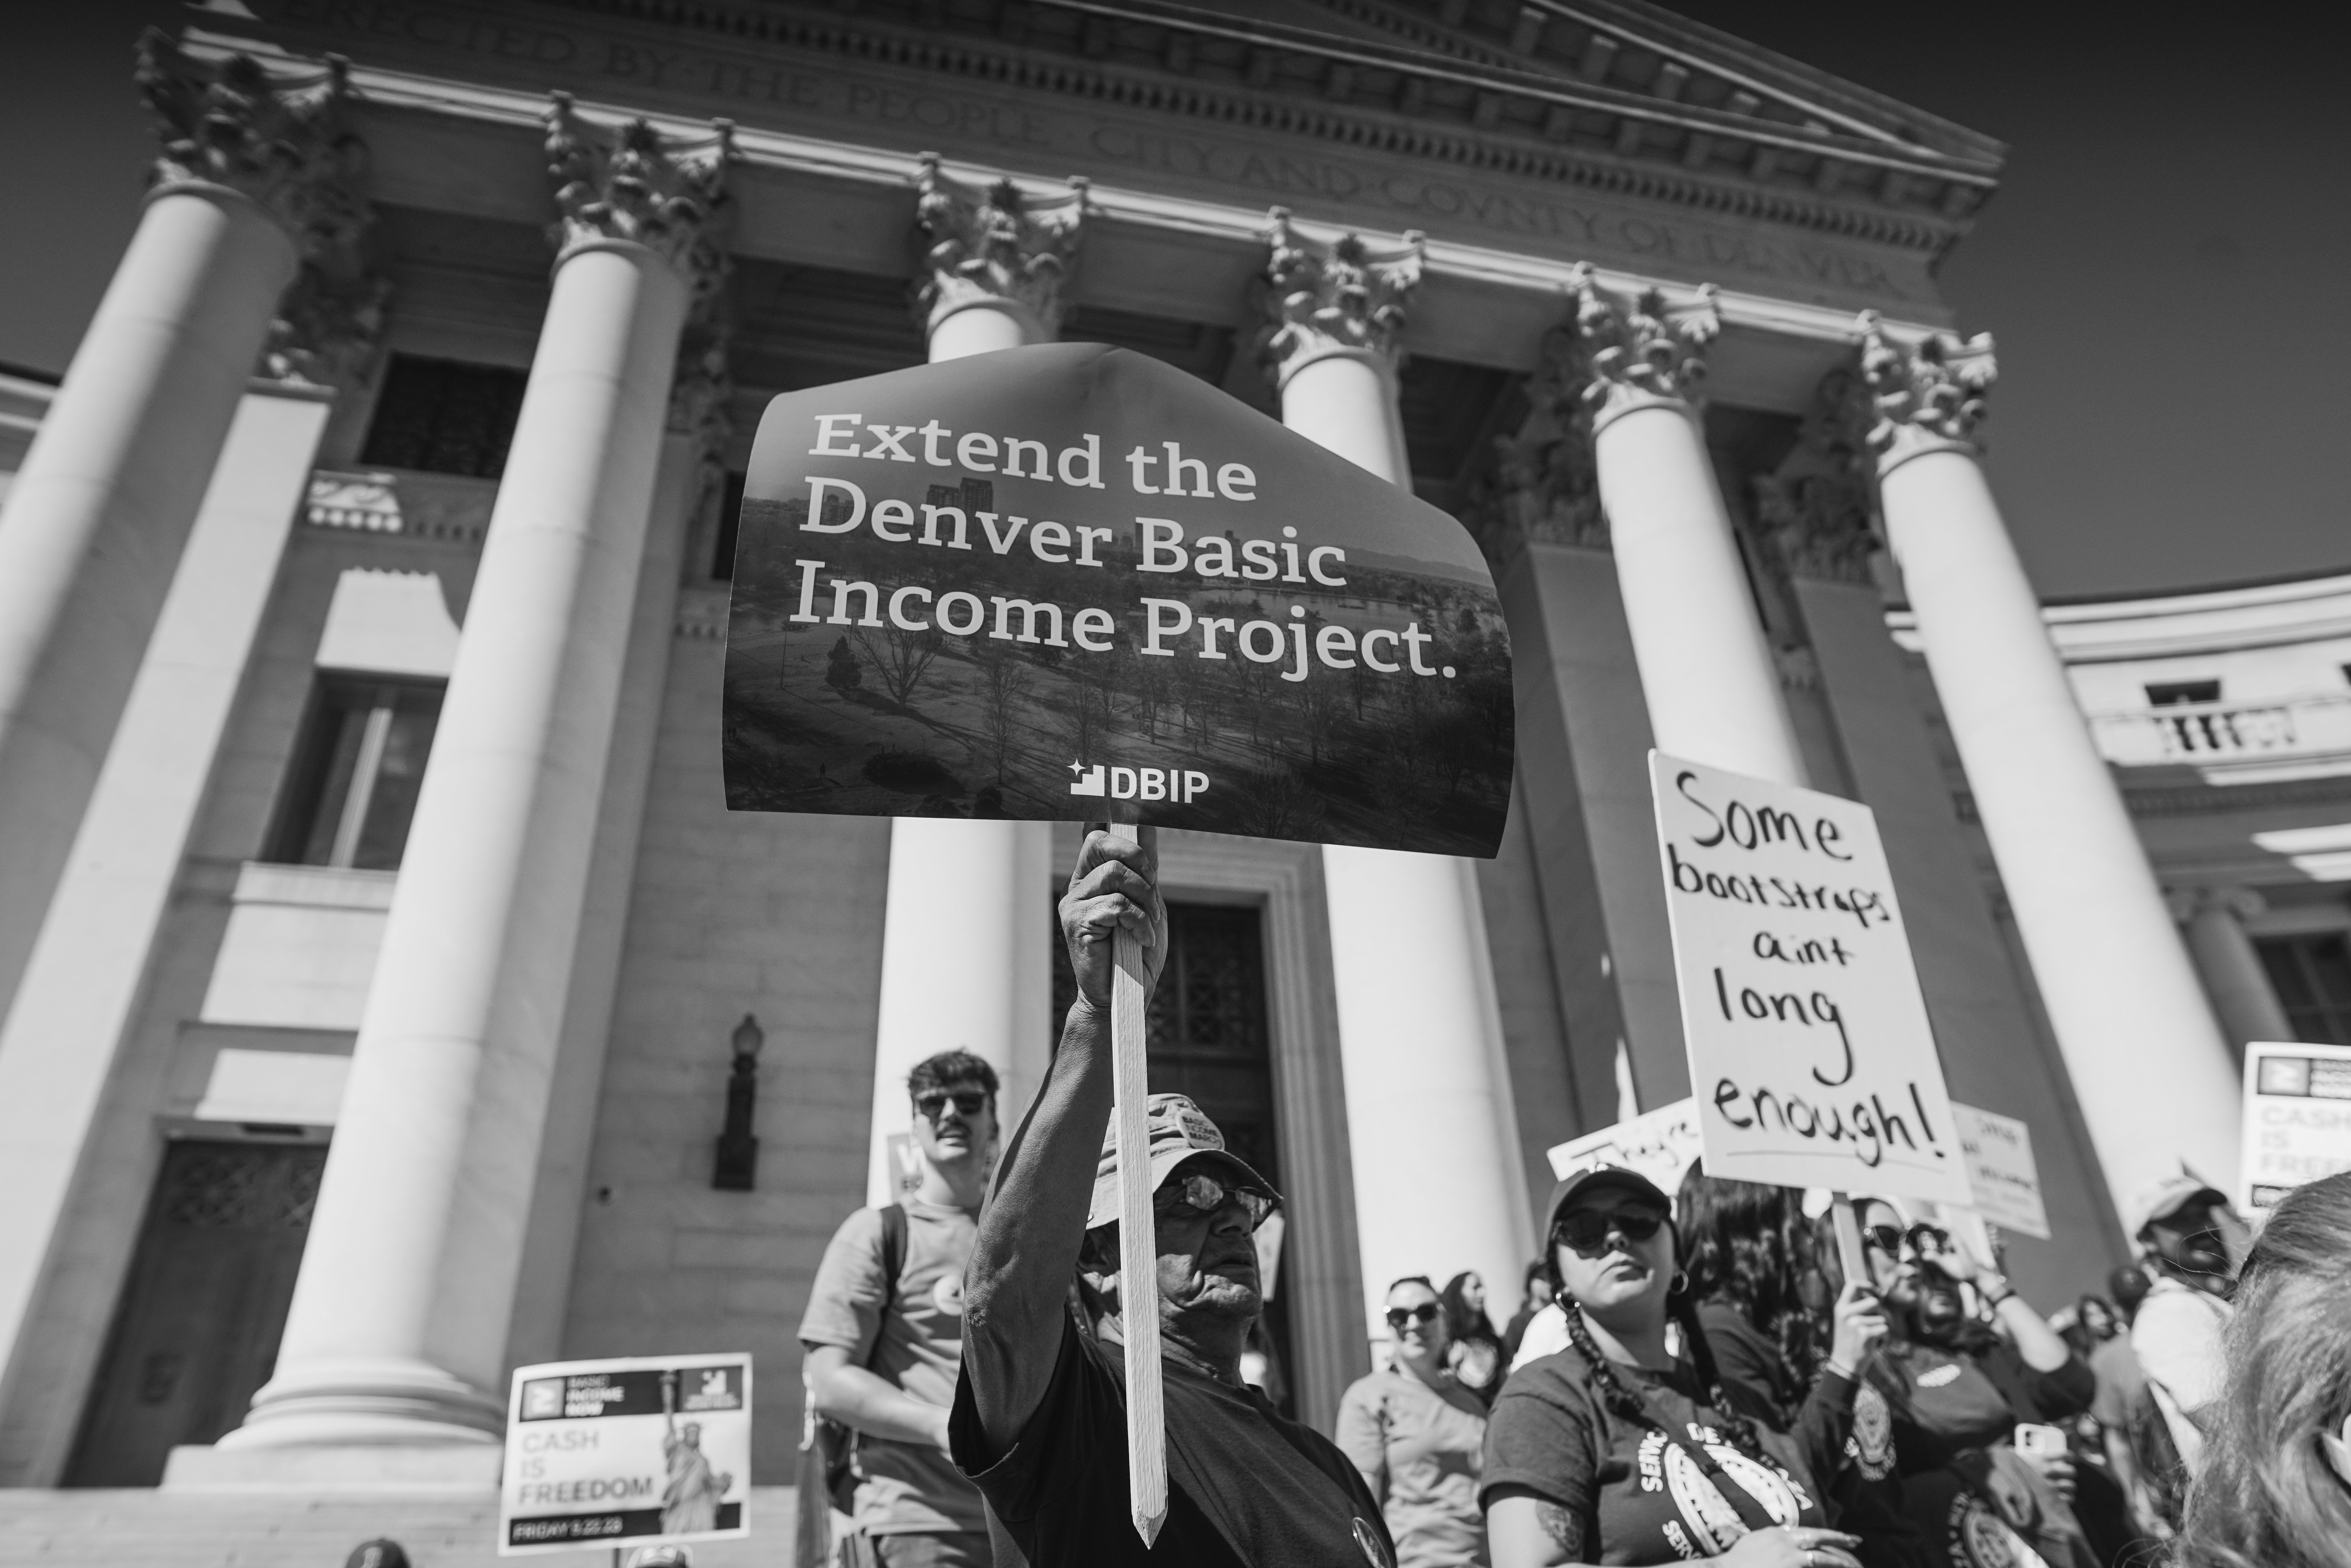
Denver, Colorado allocated $4 million in ARPA funds to support the Denver Basic Income Project, one of the largest guaranteed income programs in the U.S., providing monthly cash payments to individuals and families experiencing homelessness to promote stable housing and address rising homelessness.
ARPA Equity Assessment of Denver, CO
Overall Equity Focus
 High
HighWas racial and economic equity an explicit focus of the jurisdiction's ARPA investment strategy?
 95% of locations met this criterion.81% of locations met this criterion.86% of locations met this criterion.
Equity Decision Making Tools and Resources
HighAre equity tools, frameworks, and structures in place to support equitable investment project identification, design, and implementation?
38% of locations met this criterion.Denver's equity work is guided by four citywide goals: 1) being an inclusive employer where city staff are given the tools to advance social justice; 2) integrating social equity, race, and social justice into policies, practices, programs, and budgetary decisions to create equitable outcomes; 3) being an inclusive government that effectively engages the community to create equitable outcomes; and 4) using nationally recognized research and data-driven practices to support the City’s progress toward social justice initiatives.
24% of locations met this criterion.In 2020, Denver passed Executive Order 146: to establish the Office of Social Equity and Innovation (OSEI). OSEI strives to increase systems, policies, and practices that sustain social equity, race, and social justice.
31% of locations met this criterion.Denver has developed a Budget Equity Framework to operationalize identifying and developing budget requests that support historically marginalized communities, or mitigating impacts of budget decisions that negatively impact these communities.
51% of locations met this criterion.The Office of Social Equity and Innovation (OSEI), originally launched in 2019 and officially established in 2020, works to increase systems, policies, and practices that sustain social equity, race, and social justice to ensure that equity is embedded in all facets of Denver’s operations.
31% of locations met this criterion.Denver is using two equity tools: 1) The Recovery Index looks at the economic, health, and educational wellbeing of various neighborhoods. This online interactive index displays how neighborhoods score on economic, health, and educational wellbeing measures; and 2) The Neighborhood Equity Index is used by The Department of Public Health & Environment to identify where the greatest health disparities exist in Denver to inform their programs.
48% of locations met this criterion. 72% of locations met this criterion.38% of locations met this criterion.
Community Engagement
HighDid the jurisdiction engage community members in decision making about the ARPA funds, conduct targeted outreach to historically excluded communities, and implement strategies to reach underserved communities?
94% of locations met this criterion.64% of locations met this criterion.54% of locations met this criterion.Equitable Labor Practices
 Low
LowDoes the jurisdiction use best practices for ensuring public investments deliver family-supporting jobs to residents who have faced barriers to good jobs and economic prosperity?
36% of locations met this criterion.16% of locations met this criterion.70% of locations met this criterion.29% of locations met this criterion.11% of locations met this criterion.Equity Investments
HighDid the jurisdiction make investments that have the potential to advance equity by targeting the communities most harmed by the pandemic and addressing systemic inequities?
62% of locations met this criterion.71% of locations met this criterion.64% of locations met this criterion.82% of locations met this criterion.63% of locations met this criterion.81% of locations met this criterion.45% of locations met this criterion.33% of locations met this criterion.32% of locations met this criterion.64% of locations met this criterion.64% of locations met this criterion.31% of locations met this criterion.67% of locations met this criterion.56% of locations met this criterion.50% of locations met this criterion.Transparency & Accountability
HighDoes the jurisdiction set performance goals, collect data to monitor progress toward equitable outcomes, and provide the public with information about how funds are being used?
55% of locations met this criterion.70% of locations met this criterion.64% of locations met this criterion.75% of locations met this criterion.